
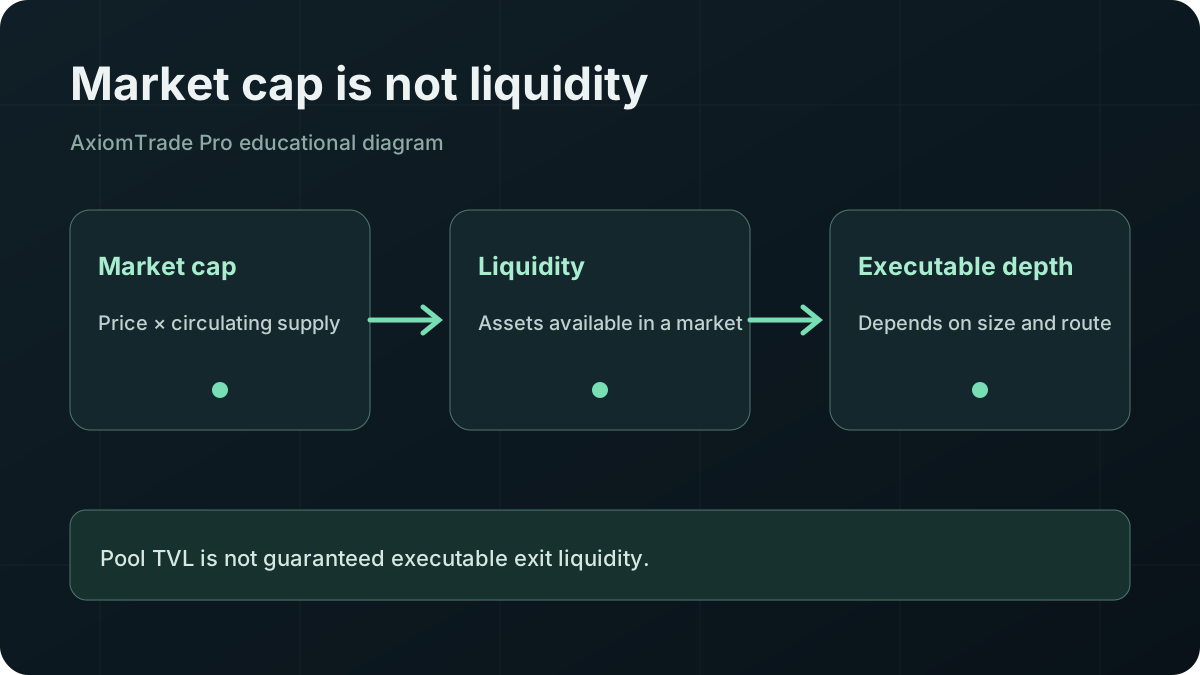
Market capitalisation is generally a reference token price multiplied by circulating supply. It is not the cash deposited into a token, the amount backing it, or the amount holders can collectively withdraw. Liquidity describes assets available in markets, while executable depth depends on pool design, reserves, price ranges and order size. A token can display a large market cap and still have little capacity for a sale without substantial price impact.
01 / VALUATION METRIC
What Market Capitalisation Means
Token market capitalisation applies a current or last-traded unit price to a supply figure. In simplified notation:
Market cap = reference price × circulating supply.
The result is a valuation metric. Only a small fraction of the supply may have traded near the reference price. Multiplying that marginal price across every circulating unit does not imply that buyers contributed that total amount or that every holder can sell at that price.
Data providers can disagree because they use different supply definitions, market sources, stale prices or methods for excluding locked and program-controlled units. Always inspect the inputs instead of treating the displayed number as an audited balance sheet.
02 / FORMULA INPUTS
Circulating Supply and Token Price
Circulating supply attempts to count units available to the public market, but “available” can require judgement. Team allocations, vesting accounts, burned units, treasury holdings, bonding curves and bridge representations may receive different treatment across dashboards.
The price input also matters. A pool’s marginal quote describes the next small trade under current reserves; it is not the price at which the complete supply could be sold. If a thin trade moves the last price higher, the calculated market cap can jump even though little new capital entered the market.
Solana’s mint account records total supply and decimals, but a market-data provider may apply additional offchain logic to estimate circulation. That distinction is why the raw mint and the dashboard figure should both be checked.
03 / SUPPLY SCENARIO
What Fully Diluted Valuation Represents
Fully diluted valuation (FDV) usually multiplies a reference price by a maximum or fully issued supply. It asks what the token’s valuation would be at that same price if the selected full supply existed in the market. It does not predict that the price will remain unchanged as supply unlocks or is minted.
Compare FDV with circulating market cap to understand potential dilution, then inspect the actual mint authority, vesting schedule and release conditions. A very large gap can be worth investigating, but it does not alone prove future selling. Conversely, equal market cap and FDV do not establish decentralised ownership or adequate liquidity.
04 / TRADING CAPACITY
What Liquidity Means in a Token Market
Liquidity is the ability to buy or sell without an outsized change in price. On a decentralised exchange, displayed pool liquidity commonly values assets deposited into one or more pools. The useful question is not simply “How much TVL is shown?” but “What output can this particular order execute for now?”
Usable depth can differ by side of the trade, pool, fee tier and active price range. A quote routed through several pools may offer different depth from the largest visible pool. Liquidity can also be added or removed after the check. Pool TVL should never be treated as guaranteed cash available at the current token price.
05 / CONCEPTUAL MECHANICS
How Liquidity Pools Work
A liquidity pool holds assets in program-controlled accounts and uses a pricing rule to quote exchanges. In a basic constant-product model, buying the token removes token units and adds the paired asset; the ratio changes, so later units cost more. Other automated market makers use concentrated liquidity or different curves, so this model is educational rather than universal.
The average price across an order therefore differs from the marginal price shown before it. Larger orders consume more of the available curve and generally create greater price impact. Fees and market movement add separate effects.
You cannot assume the entire quoted value is withdrawable by one seller at the displayed marginal price. The curve changes throughout the trade.
06 / SIDE-BY-SIDE
Market Cap Versus Available Liquidity
| Metric | What it measures | What it does not prove |
|---|---|---|
| Market cap | Reference price multiplied by estimated circulating supply | Cash backing, money invested or exit liquidity |
| FDV | Reference price multiplied by a selected fully diluted supply | Future price or actual future circulation |
| Pool TVL | Estimated value of assets currently attributed to a pool | Guaranteed executable depth at one price |
| Volume | Reported value traded over a period | Unique demand, organic activity or remaining depth |
| Price impact | Estimated quote change caused by a particular order | Future volatility or quote-to-settlement slippage |
| Holder count | Count based on visible token accounts or owners under a provider’s method | Number of unique real-world investors |
07 / ORDER SIZE
Why Large Trades Can Move Token Prices
An order is “large” relative to the market it enters, not in absolute dollars. A $1,000 order can be negligible in one pool and disruptive in another. As the trade consumes reserves, each additional unit can execute at a less favourable rate. Aggregators may find alternative routes, but they cannot manufacture absent liquidity.
This is price impact caused by the order itself. Slippage describes further quote-to-execution variation. Review the slippage guide to keep these concepts separate, and account for explicit charges using the Axiom fee guide.
08 / LABELLED ASSUMPTIONS
Hypothetical Examples
Example A: high valuation, shallow pool
Assume a dashboard uses a $0.01 marginal price and 100 million circulating tokens. The displayed market cap is $1 million. Separately, assume one pool reports $20,000 of total value split between the token and a paired asset. The $1 million figure is not $1 million available to sellers, and even the $20,000 TVL is not executable at a fixed price. A sale changes the reserve ratio as it proceeds.
Example B: a small trade sets a large headline
Assume a thin pool’s last small purchase moves the marginal price from $0.01 to $0.015 while the circulating-supply estimate remains 100 million. The displayed market cap rises from $1 million to $1.5 million, a $500,000 increase, but that arithmetic does not mean $500,000 entered the pool. It applies a new marginal price to every circulating unit.
Example C: identical market cap, different execution
Two tokens can each display a $2 million market cap. If one has several deep pools and the other has one shallow pool, the same sale can produce very different output and price impact. Market cap alone cannot rank their tradability.
09 / COMMON ERRORS
Common Misleading Interpretations
- “The market cap is money invested.” It is an arithmetic valuation, not cumulative net deposits.
- “The pool has enough TVL for my sale.” Asset composition and the curve determine output; not all TVL is available at one price.
- “High volume means deep liquidity.” The same liquidity can turn over repeatedly, and reported activity may include bots.
- “A low price makes the token cheap.” Unit price depends on supply; valuation and distribution provide context.
- “FDV will become market cap.” Supply changes can alter price and demand; FDV holds price constant as an illustration.
10 / PRACTICAL COMPARISON
A Market-Cap and Liquidity Checklist
- Verify the exact mint and token program.
- Identify the supply figure used for market cap and its exclusions.
- Compare circulating supply, total supply and any mint or unlock capability.
- Find each relevant pool and inspect paired-asset reserves.
- Request a quote for the intended order size and read price impact.
- Check whether liquidity is concentrated in a narrow price range.
- Review holder concentration and label pool or program accounts.
- Compare recent liquidity and volume changes, not one snapshot.
- Test assumptions again before signing because state changes.
Use Pulse fields as inputs to this research, then apply the token safety framework before drawing a conclusion.
11 / SOURCES & METHOD
Primary References and Limitations
- Solana — Mint and token account mechanics
- Axiom — Market data fields
- Axiom — Pulse filter definitions
Checked 19 October 2026. Market-cap and liquidity explanations are general educational mechanics. Numerical examples are hypothetical and deliberately avoid representing any real token or guaranteed depth.
12 / FAQ
Frequently Asked Questions
Is market cap the amount invested in a token?
No. It applies a reference price to a supply estimate; it does not total cash contributed or backing.
Is liquidity the same as market cap?
No. Liquidity concerns trading capacity, while market cap is a valuation calculation.
Can everyone sell at the displayed market-cap price?
No. Selling changes available prices, especially in shallow pools, so aggregate exits cannot be valued at one marginal quote.
Is pool TVL guaranteed exit liquidity?
No. The curve, asset mix, active ranges, route, fees and order size determine executable output.
What is fully diluted valuation?
It generally applies a reference price to a maximum or fully issued supply. It is a scenario, not a future-price prediction.
Why does market cap jump after a small buy?
A small trade can move a thin market’s marginal price, which is then multiplied across the supply estimate.
13 / THE TAKEAWAY
Value the Metric, Then Test the Market
Market cap helps compare price and supply under a stated method. Liquidity and quote depth answer a different question: what can trade now, at what average result? Use both, inspect their inputs and never translate a valuation headline into assumed cash backing or guaranteed exit capacity.